Note
Click here to download the full example code
Block Permutations
The permutations of hyppo.independence.Dcorr can be restricted to appropriately match known
dependencies of samples under the null distribution (i.e. multilevel and longitudinal data). Without such modifications, calculated
pvalues are invalid as the default space of permutations are misspecified.
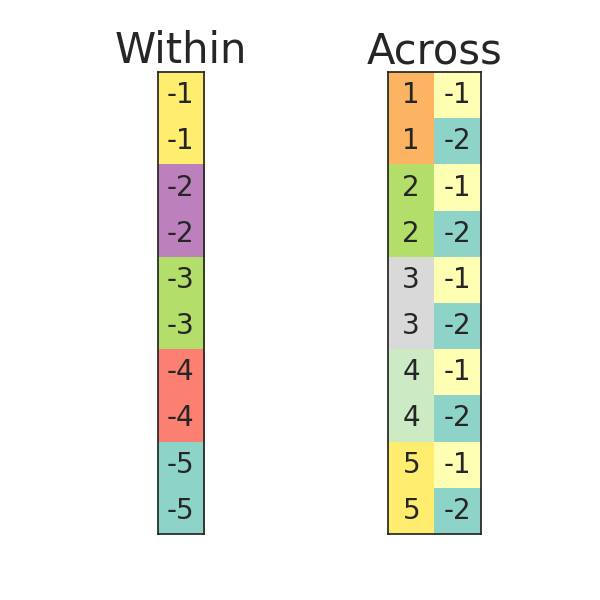
In order to restrict the permutations, we pass in a list of group labels. Each column is a list of labels which partitions the observations by shared label into blocks and multiple columns repeat this process recursively. At each level, blocks are exchangeable unless the label is a negative number, in which case it is fixed, and all elements of the final blocks are exchangeable. This defines the space of allowable permutations and the \(Y\) matrix is permuted accordingly.
The block labels used in this notebook are visualized below, corresponding to data where observations are dependent within pairs. Because of the \(Y\) values in our 2-sample testing case, block labels of \([1, 1, 2, 2, \ldots]\) would also have been allowable for both cases but would lead to unnecessary permutations being computed.
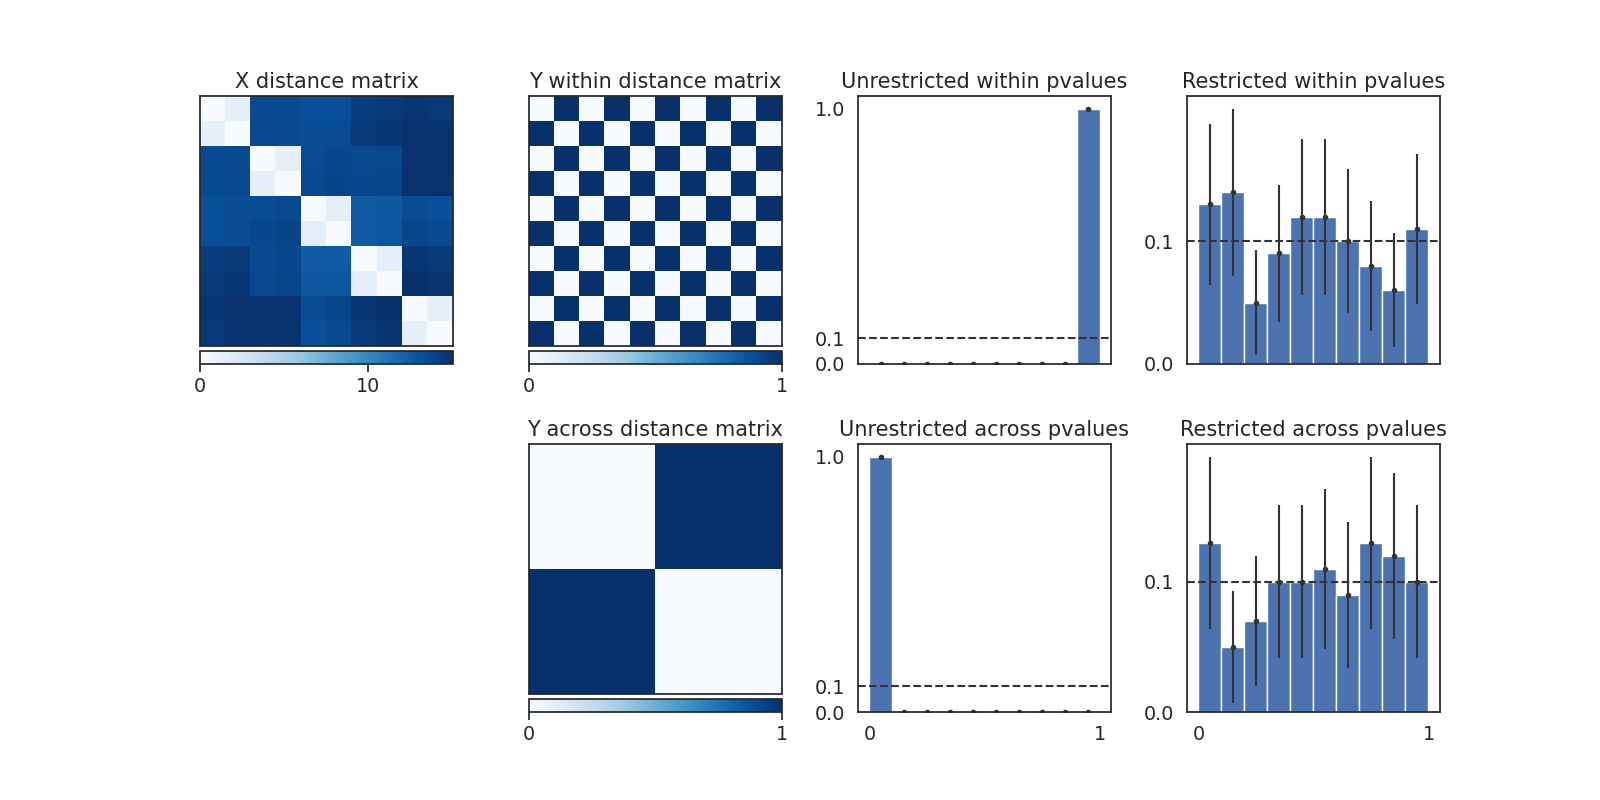
As shown in the following figures, pvalues under the default permutations are heavily skewed and certainly not uniform, thus presenting either an inflated false positive rate or potentially incredibly low power. When the permutations are restricted, the pvalues under the null distribution are empirically approximately uniformly distributed, as we would hope for. 95% binomial proportion confidence interval error bars are displayed on the histogram of empirical p-values for each bin.
from collections import defaultdict

import matplotlib.pyplot as plt
import numpy as np
import seaborn as sns
from mpl_toolkits.axes_grid1 import make_axes_locatable
from scipy.spatial.distance import pdist, squareform

# custom seaborn plot options to make the figures pretty
sns.set(color_codes=True, style="white", context="notebook", font_scale=1.25)
PALETTE = sns.color_palette("Set1")
sns.set_palette(PALETTE[3:])

import warnings

warnings.filterwarnings("ignore")

from hyppo.independence import Dcorr


def simulate_2sample_null(n1, n2=None, d=100, group_std=0.1, seed=None):
    """
    Simulates a set of paired observations for a 2-sample test.

    n1,n2 : size of the two groups. Are both n1 if n2 is None
    d : dimension of observations
    group_std : standard deviation of normal distribution around group mean
    """
    np.random.seed(seed)

    # Means for each observation
    mus1 = np.random.normal(0, 1, (n1, d))
    if n2 is not None:
        mus2 = np.random.normal(0, 1, (n2, d))

    # Paired observations
    X = np.vstack(
        [np.random.normal(mu, group_std, (2, d)) for mu in mus1]
        + [np.random.normal(mu, group_std, (2, d)) for mu in mus2]
    )
    return X


# Simulation parameters
n1 = 25
n2 = 25
d = 100
group_std = 0.1

# Labels
Y_within = np.asarray([0, 1] * (n1 + n2))
Y_across = np.hstack(([0] * n1 * 2, [1] * n2 * 2))

# Permutation tree blocks
blocks_within = -1 * np.hstack([[i + 1] * 2 for i in range(n1 + n2)]).T
blocks_across = np.c_[
    np.hstack([[i + 1] * 2 for i in range(n1 + n2)]), -1 * Y_within - 1
]

# Test params
test_blocks = [None, None, blocks_within, blocks_across]
test_names = [
    "Unrestricted within",
    "Unrestricted across",
    "Restricted within",
    "Restricted across",
]
test_Ys = [Y_within, Y_across, Y_within, Y_across]

# Plot permutation tree blocks figure
fig, axes = plt.subplots(1, 2, figsize=(6, 6))

for ax, data in zip(axes, (blocks_within[:, np.newaxis], blocks_across)):
    ax.matshow(data[:10], cmap="Set3")
    for (i, j), z in np.ndenumerate(data[:10]):
        ax.text(j, i, "{:}".format(int(z)), ha="center", va="center", fontsize=20)
        ax.set_xticks([])
        ax.set_yticks([])
axes[0].set_title("Within", fontsize=30)
axes[1].set_title("Across", fontsize=30)
plt.suptitle("Permutation Tree Blocks", y=1.07, fontsize=30)
plt.show()


# Independence tests figures
N_DATASETS = 100
REPS = 100
test_results = defaultdict(list)

for i in range(N_DATASETS):
    X = simulate_2sample_null(n1, n2, d, group_std, seed=i)
    for test, block, Y in zip(test_names, test_blocks, test_Ys):
        _, pval = Dcorr().test(
            X,
            Y,
            reps=REPS,
            workers=-1,
            perm_blocks=block,
        )
        test_results[test].append(pval)

# fig, axes = plt.subplots(2,3, figsize=(4, 4*len(data_dict.keys())))
fig = plt.figure(figsize=(16, 8))

# Show data example
ax = fig.add_subplot(241)

X = simulate_2sample_null(n1, n2, d, group_std, seed=0)[:10, :]
X = squareform(pdist(X))
heatmap = ax.pcolor(X, cmap=plt.cm.Blues)
ax.invert_yaxis()
ax.xaxis.tick_top()
ax.set_xticks([])
ax.set_yticks([])
ax.set_title("X distance matrix")

divider = make_axes_locatable(ax)
cax = divider.append_axes("bottom", size="5%", pad=0.05)
plt.colorbar(heatmap, cax=cax, ticks=[0, 10], orientation="horizontal")


# Plot Y matrices
ax = fig.add_subplot(242)
heatmap = ax.pcolor(squareform(pdist(Y_within[:10, np.newaxis])), cmap=plt.cm.Blues)
# ax.colorbar(heatmap)
ax.invert_yaxis()
ax.xaxis.tick_top()
ax.set_xticks([])
ax.set_yticks([])
ax.set_title("Y within distance matrix")

divider = make_axes_locatable(ax)
cax = divider.append_axes("bottom", size="5%", pad=0.05)
plt.colorbar(heatmap, cax=cax, ticks=[0, 1], orientation="horizontal")

ax = fig.add_subplot(246)
heatmap = ax.pcolor(
    squareform(pdist(np.hstack((Y_across[:5], Y_across[-5:]))[:, np.newaxis])),
    cmap=plt.cm.Blues,
)
# ax.colorbar(heatmap)
ax.invert_yaxis()
ax.xaxis.tick_top()
ax.set_xticks([])
ax.set_yticks([])
ax.set_title("Y across distance matrix")

divider = make_axes_locatable(ax)
cax = divider.append_axes("bottom", size="5%", pad=0.05)
plt.colorbar(heatmap, cax=cax, ticks=[0, 1], orientation="horizontal")


# Plot pvalue histograms and errorbars using binomial CIs
ax = None
for i, test_name in zip([3, 7, 4, 8], test_names):
    ax = fig.add_subplot(int(str(f"24{i}")))  # , sharey=ax)
    n = len(test_results[test_name])
    entries, edges, _ = ax.hist(
        test_results[test_name],
        bins=np.arange(0, 1.1, 0.1),
        weights=np.ones(n) / n,
        color="b",
    )
    # entries = height of each column = proportion in that bin
    # calculate bin centers
    bin_centers = 0.5 * (edges[:-1] + edges[1:])
    ax.axhline(y=sum(entries) / len(bin_centers), ls="--", c="#333333")
    # errorbars are binomial proportion confidence intervals
    ax.errorbar(
        bin_centers,
        entries,
        yerr=1.96 * np.sqrt(entries * (1 - entries) / n),
        fmt=".",
        c="#333333",
    )
    ax.set_title(f"{test_name} pvalues")
    # ax.set_xlim(0,1)
    if i in [3, 4]:
        ax.set_xticks([])
    else:
        ax.set_xticks([0, 1])
    if i in [4, 8]:
        ax.set_yticks([0, 0.1])
    else:
        ax.set_yticks([0, 0.1, 1])
plt.subplots_adjust(hspace=0.3, wspace=0.3)
plt.show()
Total running time of the script: ( 0 minutes 57.936 seconds)